Recruitment Analytics and Staffing Reporting for the Staffing Industry.
In this blog, we will explore the various ways to collect and show data from views to charts to Power BI reports. So whether its ‘time to fill’, GM and burden analysis, pipeline visibility, sales and recruiting performance visibility 1Staff has you covered.


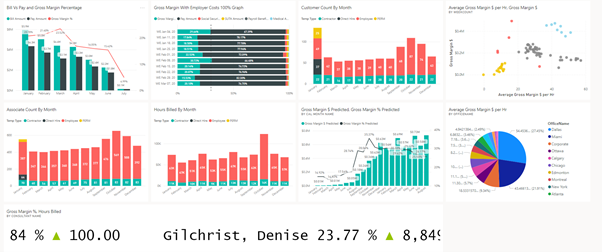
Powerful Interactive Dashboarding

Flexible Actionable Views

Rich Visual Interactive charts

Enrich with Microsoft Power BI

The Power of 1Staff Analytics.
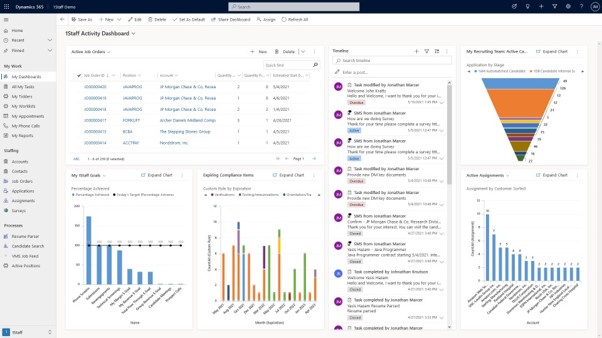
Powerful interactive Dashboarding
Empower your team with role-tailored dashboards that combine multiple interactive graphs and data grids. Create new dashboards in minutes. Each user sees filtered data that is relevant to them or their team. Turn information into action with real-time sales, marketing, recruiting, onboarding, and back office data that is prioritized in one place.
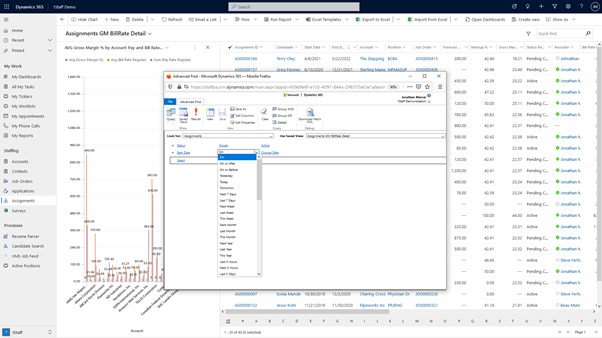
Flexible Actionable Views
A view is an easy to use reporting tool. 1Staff comes with many predefined views which within one click can be customized or added to meet the users precise needs. Custom views allow you to display the fields you want from a defined subset of your data through a powerful builder called Advanced Find.
Advanced Find enables complex queries of any field on a record and its related records too. For example, you can display a list of assignments starting within a designated time period, the following week, for example, where pre boarding activities remain outstanding or on inbound jobs don’t meet a predefined target margin. On that view, you can display any pertinent data, for example pay and bill rates, contact details, resume link or text. If you want to further format, summarize and distribute information from your view for a highly custom look, Excel export is only a few clicks away.
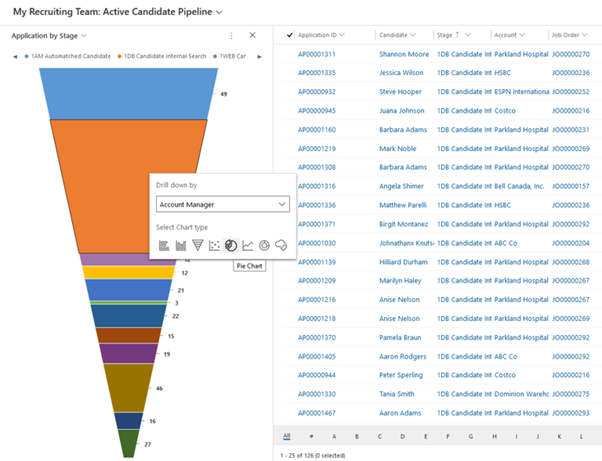
Rich Visual interactive charts
While a view is an excellent way to find and report on data, it lacks the beauty and summarizing power of a chart. One of the great features of the chart is it allows the end user to interact with the chart to filter the data in their view and drilldown layer by layer into the underlying data. It is great for this kind of data exploration.
For example, a chart summarizing expected revenue per month allows you to drill into a specific month to chart expected revenue by say account and then by assignment. Not only can you see the expected revenue, but also identify the Sales Rep and Recruiter responsible as well.
Switching between views and charts is easy, you can quickly see and select a different chart over a different view, side by side, using the chart to filter your view, if find then act.
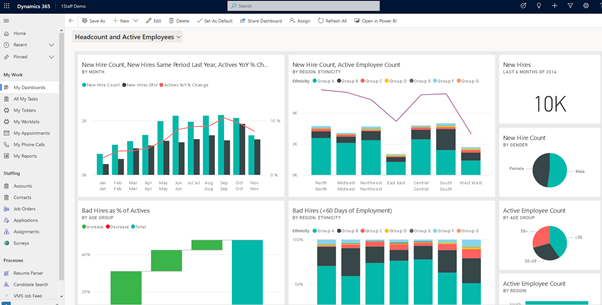
Enrich with Power BI
Out of the box, you can embed Microsoft Power BI into Dynamics 365 personal dashboards.
Power BI is the “go-to” platform to deliver data-driven insights into everyone’s hands. Reports, Charts and KPI’s can be created in Power BI with “out of box” data connectors for Microsoft Products and non-Microsoft applications.
One published user can choose to include Power BI tiles on their dashboard along with other, standard Dynamics 365 charts and views. They can also create an entirely new dashboard and just “hook” it to an existing Power BI Dashboard. You can also embed a Microsoft Power BI object on forms such as the Account Form in Dynamics with charts and reports contextual to the Account record you are looking at.
Power BI can create complex reports and charts such as the example above where we are plotting potential customers on a map of Texas or do heat maps of where your revenue or potential revenue is coming from, etc.
The beauty of Power BI is its ability to provide accessibility not only to 1Staff Users, but wider users through any device and from outside 1Staff.
Add the power of 1Staff Analytics.
1Staff Analytics is designed ready to go for visualization in Power BI and therefore availability in 1Staff Front Office and Microsoft Dynamics 365.
1Staff Analytics exposes vital insights from pay/bill and Financials in 1Staff Back Office. It is designed to help you pinpoint opportunities and challenges, compare performance, and identify trends. It rationalizes your staffing performance data such as margin and full burden analysis at the key dimensions of your business, for example, Company, SBU, Office, Salesperson, Customer, Job, Contract, Recruiter. It includes out of the box logic for revenue and cost prediction, debt, and aging performance.
Staffing reporting and recruitment analytics for the staffing industry.
1Staff Front Office is powered by Microsoft Dynamics 365 (D365). It benefits from both Microsoft Dynamics 365’s inbuilt powerful reporting, analytics and AI driven insights and the wider Microsoft platform. Helping you to enrich your staffing reporting with 1Staff and Microsoft Power BI.
Learn more about 1Staff Staffing Software today!
If you’d like to find out more or talk to a specialist get in touch today.
Our Staffing Software solutions.
For over 30 years we have been developing solutions for Infor SunSystems & Microsoft, offering a choice of on premise, hybrid and Cloud solutions. Our broad technology portfolio means that we have the right solution to complement your unique business requirements.

1Staff Front Office
1Staff Front Office by Professional Advantage is a staffing software solution that fully leverages the Microsoft Dynamics platform.
1Staff Front Office
1Staff Back Office
1Staff Back Office is a complete enterprise resource planning (ERP) solution, built on two Microsoft Dynamics platforms.
1Staff Back Office
1Staff 365 Cloud Back Office
1Staff 365 Back Office is powered by Microsoft Dynamics 365 Business, the cloud enterprise resource planning (ERP) that grows as you do.
1Staff 365 Back Office
Dashboard & Reporting
Streamline your decision making with business analytics and business intelligence.
Dashboard & ReportingProfessional Advantage Managed Services
Want to find out more information on how Professional Advantage can help you with your security needs?
Please contact us to start your discussion about how our Managed Services team can help